It’s not exponential: An economist’s view of the epidemiological curve
Richard Baldwin 12 March 2020
The spread of COVID-19 is not going to follow an exponential curve – and grave errors will follow if analysts believe it will. The number of new cases rises rapidly, peaks, and then declines. It’s called the epidemiological curve. It’s not a theory or hypothesis; it plays out that way every flu season. It is how it has played out in China and Korea for COVID-19. Flattening the peak to avoid overloading the healthcare system is the main medical goal of the seemingly extreme containment policies we have seen to date.
Have you seen the zombie movie “World War Z” with Brad Pitt? One zombie makes two, who make four, who – well, this quickly gets out of hand. In a flash, a supermarket full of humans becomes a raging mass of slavering zombies in Hollywood’s finest make-up.
- This is not an exponential growth process.
Why? While zombies never die and they never get better, they do eventually have trouble finding new victims. What’s more, surviving non-zombies start taking extreme containment measures that reduce the rate of infection – and produce great drama. COVID-19 is not the zombie disease – no surprise there – but it may help us think about the virus’s epidemiological features.
With COVID-19, most patients get better (over 70,000 have recovered from the disease),1 some do, tragically, die, and uninfected people start taking measures to reduce the rate of infection.
- That is why the number of new cases is not exponential. It rises rapidly, peaks, and then declines. It’s called the epidemiological curve (‘epi curve’ for short).
It is well known to epidemiologists. It’s not a theory, or conjecture. It plays itself out every flu season (Figure 1). The Centers for Disease Control and Prevention (CDC) even has names for the stages, as shown in the bottom panel of Figure 1: investigation, recognition, initiation, acceleration, deceleration, etc.
Figure 1 Typical seasonal flu epi curve for Canada, and CDC epi curve ‘intervals’
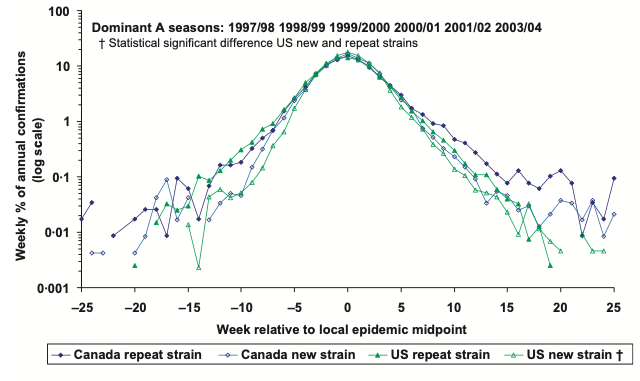
Source: Dena et al (2010).
China’s epi curve for COVID-19
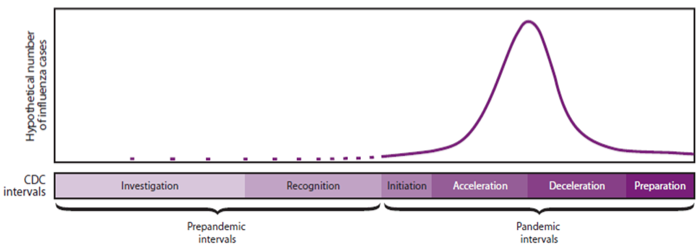
Figure 2 shows the curve for China’s experience with COVID-19 from 31 December 2019 to 11 March 2020. It illustrates why it is easy to first underestimate a disease’s spread by thinking the curve is linear, but then overestimate it by thinking it is exponential. The top-left panel shows the early days, when it didn’t really look like a problem. The bottom-left panel is during the exponential phase, the top-right panel is when its past the peak, and the bottom-right panel is the full timeline as of 11 March 2020. The spike is due to a temporary change in data-gathering standards.2
Figure 2 China’s epidemiological curve for COVID-19, 31 December 2019 – 11 March 2020.
Source: Author’s elaboration of European CDC data, https://www.ecdc.europa.eu/en/publications-data/download-todays-data-geographic-distribution-covid-19-cases-worldwide
Plainly, an analyst who was innocent of the shape of the typical epidemiological curve would have gravely underestimated the problem in mid-January 2020. S/he would then have gravely overestimated it in early February.
What is not shown, since it has not happened, is how viruses often come back after they subside. In other words, the epi curve starts to look like a sine wave. Figure 3 shows the results of a recent simulation by epidemiologists on COVID-19’s possible evolution for the rest of 2020.
Figure 3 Simulation of COVID-19’s new case evolution in 2020
Source: Anderson et al. (2020)
As we know, the Chinese government understood both the epi curve and the gravity of the situation. They quickly took extreme measures to reduce the rate of transmission – or they seemed extreme to many at the time.
South Korea has also worked its way into the deceleration phase that Figure 4 shows. The US epi curve as of 11 March 2020 is plotted on the right-scale for comparison; note the differences in the scales.
Figure 4 Epi curve for South Korea versus the US as of 11 March 2020.
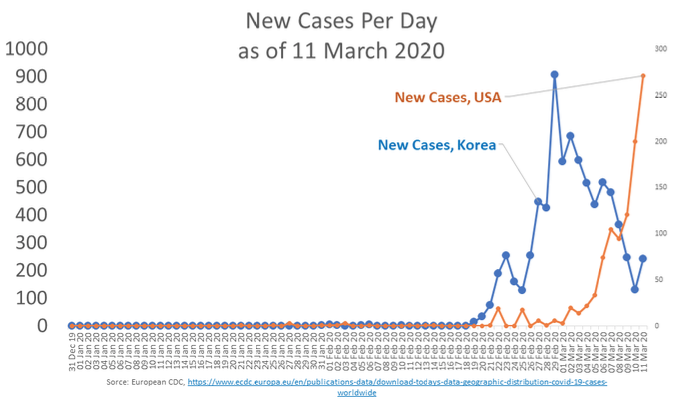
Source: Author’s elaboration of European CDC data, https://www.ecdc.europa.eu/en/publications-data/download-todays-data-geographic-distribution-covid-19-cases-worldwide
Flattening the curve: Understanding textbook public health containment policies
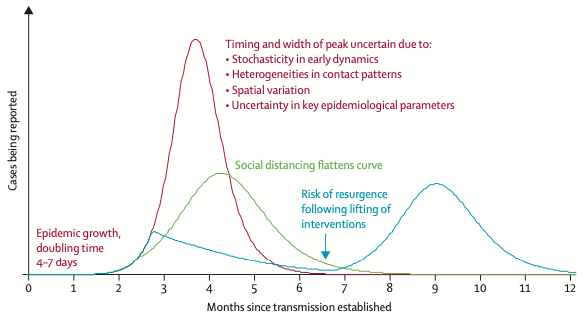
What was the Chinese government thinking when they locked down tens of millions? Given there are no 21st century tools to fight the virus, the key is to ‘flatten the curve’. Figure 5 explains why.
Figure 5 Epi curve flattening saves lives by avoiding hospital overloads

Source: Author’s elaboration.
The red epi curve illustrates what a pandemic like COVID-19 might look like. In COVID-19 cases, about 5% or 10% of those afflicted need hospitalisation. If the epi curve rises too sharply, the number of patients needing intensive care unit (ICU) beds may exceed the capacity of local hospitals.
- The point is simple. During its rapid growth phase, the number of people needing hospitalisation can grow in leaps in bounds – so fast that it overwhelms a nation’s healthcare system. This is happening right now in Italy.
This week, the leading Italian newspaper, Corriere della Sera, reported “scenes of wartime triage, where old patients have to be left by the wayside.”
A doctor interviewed by Corriere della Sera said the principle of ‘first come, first served’ has been abandoned. Another doctor said: “The choice is made inside of an emergency room used for mass events, where only COVID-19 patients enter. If a person is between 80 and 95 and has severe respiratory failure, he probably won’t make it.”
That is why Italy is now taking what may seem like extreme measures to many. Only they are not extreme compared to the nightmare alternative of overwhelmed hospitals unable to provide the care people need to survive the disease.
The blue curve in Figure 4 illustrates the epi curve when anti-transmission policies are instituted for public health reasons. The classic ones are shutting offices, factories, schools and government offices, and cancelling large public events. They can get more extreme, as they have in Italy and China, where massive lockdowns, store closures, and transportation bans were or are being used.
Curve-flattening policies, however, have immediate economic consequences. That is the subject of my next column.


Er, it is exponential (near as buggery) to start with. It can’t stay exponential because the N at risk decreases with each new infection. The effect of that at the start of the epidemic is negligible, hence it’s most definitely (approaching) exponential to start with. Figure 1 proves the point – linear-appearing increase on a logarithmic scale. That’s the definition of exponential!
For an economic analogy, try a Ponzi scheme. It has to burn itself out eventually.
A true exponential curve increases I infinity. There cannot be more than 7 billion total cases, and the number of new ones has to be less than that by however many cases we have had already. Agreed the section of the curve we are on at the moment is as near exponential as can be told from the rather sketchy data but the overall shape cannot be exponential, likely it would be sinusoidal without interventions, so it would be wrong to plan for continued exponential growth.
Well, a linear function also increases to infinity. And even exponential functions need infinite time to reach infinity. Things that increase to infinity exist only in the realm of pure mathematics. And to be really pendantic, humans are being born all the time, so pace the heat death of the universe, a model with a potential infinite number of events can be valid. So, what you’re saying is, we can’t use mathematical tools to model stuff even though we know the real-world limitations (and account for them by switching model at the point where we know the model isn’t going… Read more »
We sure can use mathematical tools to help predict the future. But we discard the ones that predict the impossible. Given the possibility of misdiagnosis we cannot be sure of the numbers of deaths. We know that the virus is asymptomatic in many cases, but have no idea how many. Any model we choose will only be an approximation for the available data. The data so far would fit many modals, but since we know that new cases in a given time frame must at some point decrease and cannot reach infinity we can discount linear, parabolic or exponential models.… Read more »
The author shows a curve stating “epidemic growth, doubling time 4-7 days”. How is that consistent with the claim that the current growth is not exponential? That’s the fucking definition of exponential, doubles every X. This is flamingly obvious ignorant nonsense on stilts.
What has science got to do with it, he said cynically? The ‘greenhouse’ effect of CO2 in the atmosphere is logarithmic in science, but exponential in politics/environmentalism.
There couldn’t be a problem that only Government and interested parties can solve if we rely on science.