The gravity model of trade is based on the idea that distance somewhere between influences and determines the amount of trade that will happen between two places. Bit like Newton and thus the name, square (or is it square root?) of the distance.
Peeps then say that obviously the UK should be trading with Bulgaria because distance! Except that’s not the sort of distance meant. We’re talking not about geography as such but economic distance. Economic distance being partially, and only partially, based upon geographic. I, for example, have a little piece of writing work and my editor on it bounces between Khabarovsk and Vancouver. Makes no difference over the internet that he does that or lives in Guia or Guildford. The absence of the internet would mean that geographic distance did make rather a difference.
And we can even measure how changes in technology change that economic distance and thus the volume of trade:
Trade from space: Shipping networks and the global implications of local shocks
Inga Heiland, Andreas Moxnes, Karen-Helene Ulltveit-Moe, Yuan Zi 07 January 2020
Evidence on the structure of the global container shipping network, an essential determinant of the costs of trade, is scarce. This column uses satellite data to document salient features of the network, and the expansion of the Panama Canal as a natural experiment to examine the impact this improvement to one link of the network had on worldwide trade. The analysis suggests that the expansion of the canal increased world real income by $20 billion.
Container ships are the engines of global trade in merchandise goods. In the words of Marc Levinson, author of the acclaimed book, The box, “…the shipping container has made the world smaller and the world economy bigger” (Levinson 2006). Recent studies by Bernhofen et al. (2016) and Cosar and Demir (2017) focus on the seismic changes that the worldwide adoption of container shipping technology has brought about in international trade.
As documented by Rua (2014), by now nearly all countries have container ports, constituting the nodes of the global container shipping network. There is increasing evidence suggesting that connectivity is at least as important as geographical distance in determining freight costs. However, there is scarce evidence on the structure of the network, which is an essential determinant of the costs of trade. The networked environment also implies that a shock to a port – or a link – in the shipping network, such as improvements in shipping infrastructure, can affect shipping costs and trade flows for many countries.
In a recent paper (Heiland et al. 2019), we construct a unique and novel data set based on satellite data. The data set covers the movement of all container ships worldwide in 2016. Using these data, we document salient features of the container shipping network. We then demonstrate how information about the network can be used to investigate the impact of a local shock on trade costs, global trade flows, and real incomes across countries.
Specifically, we use the Panama Canal expansion in 2016 as a natural experiment. This allows us to identify the impact of the improvement of one link of the shipping network on worldwide trade. Exploiting route information inferred from the satellite data, we estimate the impact of the Panama Canal expansion on global trade, and quantify the trade and welfare effects of the shock through the lens of a quantitative trade model.
AIS data and the shipping network
Our empirical analysis of global container ship movements has become possible due to the rapid advent of the global Automated Identification System (AIS) over the last years. AIS reporting of vessel positions offers a degree of automation in data processing and aggregation that was not previously possible. AIS messages include information regarding vessel identity, physical appearance, voyage-related information such as draught and destination. Simply put, AIS data offer real-time information on the whereabouts of all ocean-going vessels.1
Using an exhaustive data set of all port calls made by container ships in 2016, we document novel facts about the container shipping network.
- First, container ships typically operate on fixed routes, i.e. they serve a stable set of ports, akin to buses serving a fixed number of stops in a city.
- Second, shipping activity is highly concentrated across ports, with some nodes (ports) in the network handling almost two orders of magnitude more ships than the median port.
- Third, the network is very sparse in the sense that only few countries have direct shipping routes to their trade partners. Less than 6% of all 22,650 pairs of countries with container ports are directly connected.
While the AIS data provides unprecedented detail about the movement of ships, one cannot observe the movement of the cargo itself (i.e. the actual route of a shipment from country i to country j). To make progress, we use the observed shipping network along with actual travel times between all direct port-pair links and apply standard graph theory to calculate the fastest route between any potential port pair. Consider, for example, a shipping network with direct links between New York-London, New York-Hamburg, London-Oslo and Hamburg-Oslo. The fastest route between New York and Oslo might be New York-London-Oslo if this route minimises the sum of travel times of each leg of the journey.
The fastest path calculations reveal that 52% of all country-to-country connections involve stops in more than two other countries in between. Therefore, besides adding to the distance travelled by a container, indirect routes expose bilateral flows to the shipping infrastructure of other countries.
The Panama Canal expansion
To demonstrate the importance of exposure to third-country infrastructure, we analyse the global trade effects of a large improvement in local shipping infrastructure in 2016: the expansion of the Panama Canal. After ten years of construction, the extended Panama Canal opened on 26 June 2016. The massive $5.25 billion construction project was a modern engineering marvel: it nearly doubled the capacity of the canal by adding a wider and deeper third lane.
We employ our information on shipping routes to explore how exporters and importers worldwide were differentially affected by this local change in the shipping infrastructure. We find that country pairs whose fastest connection passed through the Panama Canal prior to the expansion traded 9-10% more after the expansion compared to other country pairs.
Finally, we use a canonical model of trade to quantify the general equilibrium effect of the Panama Canal expansion. Based on our analysis, the expansion increased world real income by $20 billion. While the building costs were borne by Panama alone, the gains per capita were shared by many countries, due to the network structure of shipping.
Figure 1 Panama Canal exposure by country
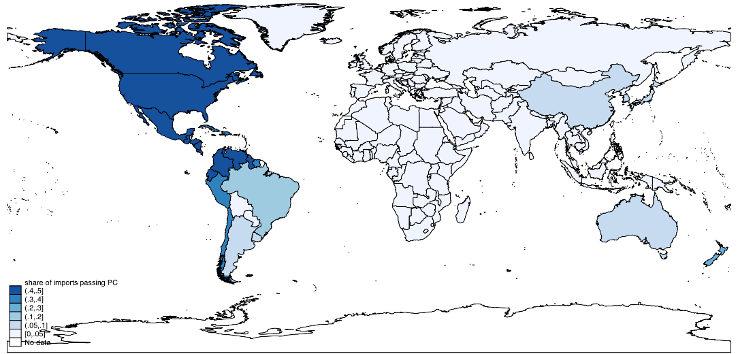
Note: The figure shows the share of imports passing through the Panama Canal in total imports by country.
The way forward
There is a growing number of studies using satellite data for economic analysis (see Donaldson and Storeygard 2016 for a review of applications). So far, however, only a few recent papers have used shipping satellite data to explore issues related to trade.
Our analysis does not just highlight the importance of shipping networks, it also points to how shipping satellite data can be used within the field of international trade. We expect many more applications in the years to come.


The UK got a lot of food from New Zealand. Food is a fairly low-cost, high bulk item, and the two places are about as far away as it is possible to be on this planet. I can’t see that distance is all that important.
What’s much more important is political alignment and mutual desire to trade the items that each side has….
Argentina built its wealth on exports of beef products to the UK in the 19th century, physical distance is a negligible and diminishing factor in trade of non-perishables and non-urgents.
Our island nation is just another example of British exceptionalism within the EU. 99% of physical exports have to go by container, and once you’ve loaded it onto a ship in Felixtowe, the difference in cost between Rotterdam as a destination and anywhere else in the world is relatively small. The same is not true for (e.g.) German exports to the EU.
Not bad for a system that started as a requirement for large ships and all passenger vessels as part of Safety of Life at Sea requirements and was used primarily fir collision avoidance and monitoring.
It’s now so cheap that leisure sailors use it and there’s so many receiving stations you can now track vessels on the Internet.
Another example of markets doing what markets do and government never thinks about.
@BiND
Shush. Don’t give them ideas about regulating and licensing AIS. Although I imagine EU already working on a compulsory expensive replacement for ships in EU waters
“While the building costs were borne by Panama alone, the gains per capita were shared by many countries …” The Chinese might think that they helped Panama just a little with the costs. And one guesses that Panama (& China) expect to recoup their building costs through the tariffs paid by shippers for using the expanded canal. And the shippers are happy to pay the tariffs because it is only a slice of the benefits they earn from larger faster cheaper shipments. The statement is about as meaningful as saying that an airline bore the cost of buying the aircraft… Read more »
A quibble, but you’re right. You could say that Panama bore the RISK that the investment might prove useless (though they shared the risk too), but the cost of solving that geographical barrier is shared by all players, and ultimately it’s not a net cost.
More succinctly:
Financial Services and Intellectual Property don’t weigh anything, so gravity models don’t apply to them.
Nah, table grapes from Chile weigh a lot, but transport was simply a technical problem that we solved, a solution we are continually refining and cost-reducing.
And even when we talk about manufacturing, that’s not machines knocking out nuts and bolts and production lines making toys. It’s about highly specialised, frequently customised manufacturing where the value isn’t in the weight but in the craft, engineering, software and support.
No-one producing hand-stitched brogues, single malt whisky, Aston Martins or medicines cares much about the cost of shipping. It’s a tiny percentage of the overall value. That really screws with the gravity model that came from a time when exports were things like food and coal.
From “Global Trade – Discovering The Bleedin Obvious”, Potato, Codswallop & Cortex Using an exhaustive data set of all port calls made by container ships in 2016, we document novel obvious facts we all already knew about the container shipping network. – First, OMG container ships typically operate on fixed routes, i.e. they serve a stable set of ports, akin to buses serving a fixed number of stops in a city. – Second, shipping activity is highly concentrated across ports, OMG, for real? with some nodes (ports) in the network handling almost two orders of magnitude more ships than the… Read more »